As I close out the 2015 election season (and begin tentatively looking toward 2016), I realize that I neglected to complete my bi-annual statistical review of my past endorsements. Yes, it’s probably as boring as it sounds . . . I’m just that kind of nerd.
I have always considered myself to be a political independent. I certainly tilt toward the Republican side of the spectrum, with a healthy dose of ‘small-l’ libertarianism thrown in, but I rarely endorse or vote for a straight party-line ticket. I always try to make a serious, dispassionate evaluation of every candidate and issue before me, and then endorse and cast my own ballot for the ones that I believe are the best available options.
I keep a running spreadsheet where I track all of my annual endorsements and the outcomes of each race. This allows me to look back at patterns in the party affiliation of the candidates I endorse, see how often the voters agree with my choices (and how often they don’t), and really visualize how my political beliefs go into practice at the ballot box. The last time I did this, I reviewed my endorsements from 2004 to 2012. This time, I’m including all races in-which I’ve been eligible to vote from 2004 through to the 2015 ballot I cast earlier this week.
Candidate Endorsements
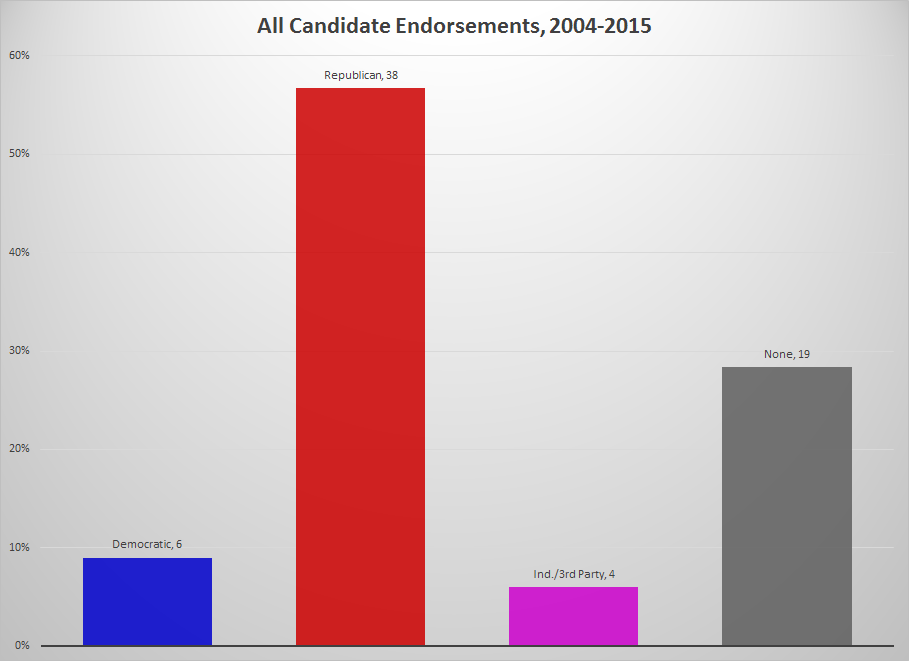
Between 2004 and 2015, I have reviewed and evaluated 163 candidates in 67 races—an average of 2.4 candidates per race and 6.1 races per year. I endorsed Democratic Party candidates in six of those races (9.0 percent), Republican Party candidates in thirty-eight races (56.7 percent), and independent or third-party candidates in four races (6.0 percent). I made no endorsement in the remaining nineteen races (28.4 percent) . . . either because there was no deserving candidate or because the office serves no purpose.
The breakdown varies depending on whether the particular race is for a federal, state, or local office.
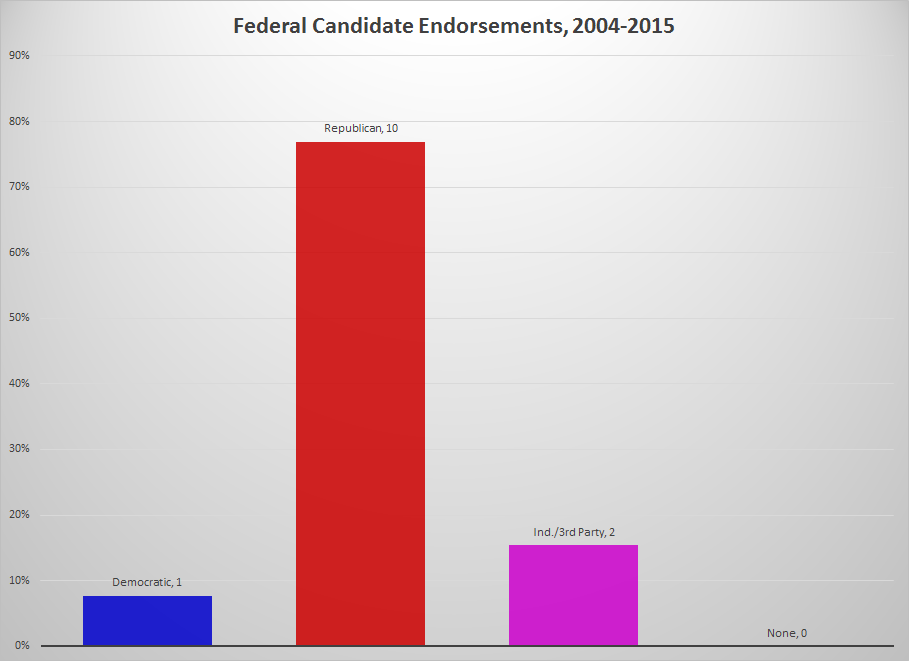
In races for federal offices—President of the United States, U.S. House of Representatives, and U.S. Senate—my Republican leanings remain very pronounced, in large part due to my concerns about human rights (the right to life, free speech and press, religious liberty, and the right to bear arms) and reestablishing a robust separation of powers between the federal and state governments. Here, I endorsed Democrats only one time (7.8 percent), Republicans ten times (76.9 percent), and independent or third-party candidates two times (15.4 percent). I have endorsed a candidate in every federal election that has been before me since 2004.
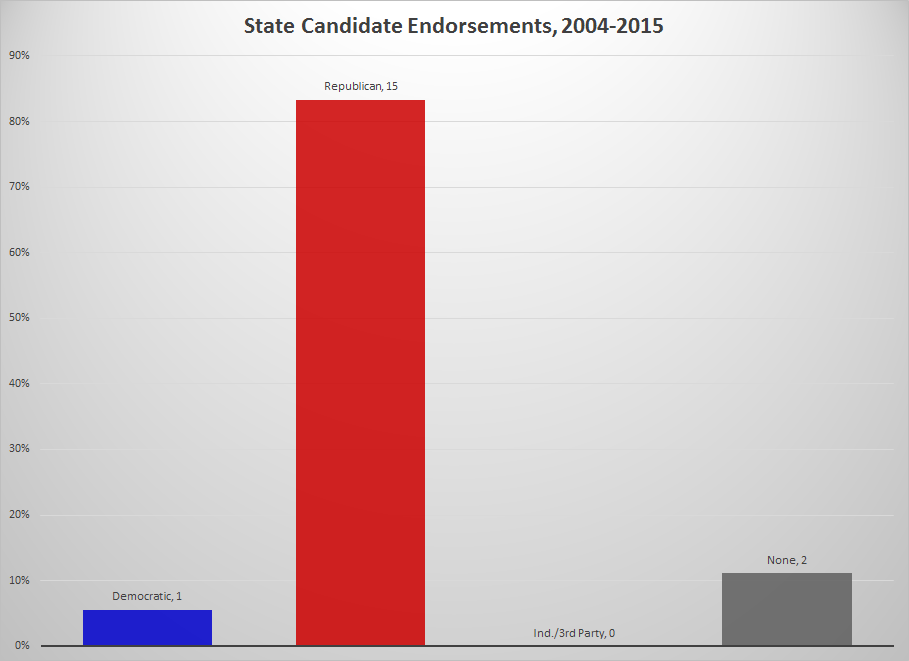
Things looks broadly similar at the state level—Governor, Lieutenant Governor, Attorney General, House of Delegates, and Senate. My endorsements went to Democrats only one time (5.6 percent) and Republicans fifteen times (83.3 percent). I have not made any independent or third-party endorsements at this level, and in two races I chose to make no endorsement (11.1 percent). My state level concerns include the same human rights and separation of powers issues I have at the federal level, as well as more ‘nitty-gritty’ areas like transportation, education, taxes, and regulation. Both major parties tend to do very poorly on education and transportation issues, but my human rights, separation of powers, taxation, and regulation concerns all tend to point me toward the Republican Party at this level.
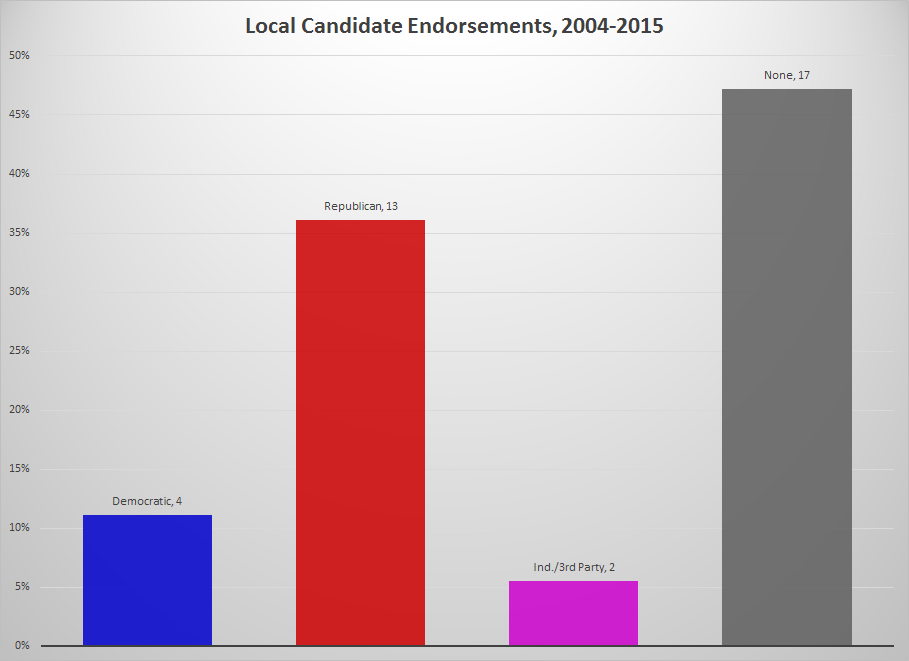
In the local races, things look a bit different. Most obviously, in seventeen local races (47.2 percent) I have made no endorsement. Nine of those seats were positions on local Soil and Water Conservation Boards, which are independent political boards with no regulatory authority and no clear reason for existing. The remaining eight were seats on local school boards, which unnecessarily politicize our education systems and serve little useful purpose. It is practically inconsequential who serves on either of these boards.
I endorsed Democrats four times (11.1 percent), Republicans thirteen times (36.1 percent), and independent or third-party candidates two times (5.6 percent) in local races. My concern at the local level is primarily with maintaining low property taxes, competent delivery of county services, and minimizing political corruption. While Republicans tend to win with regard to property taxes, it is more of a mixed-bag between the parties with regard to competence and propriety. That accounts for a much better Democratic showing in my endorsements at this level.
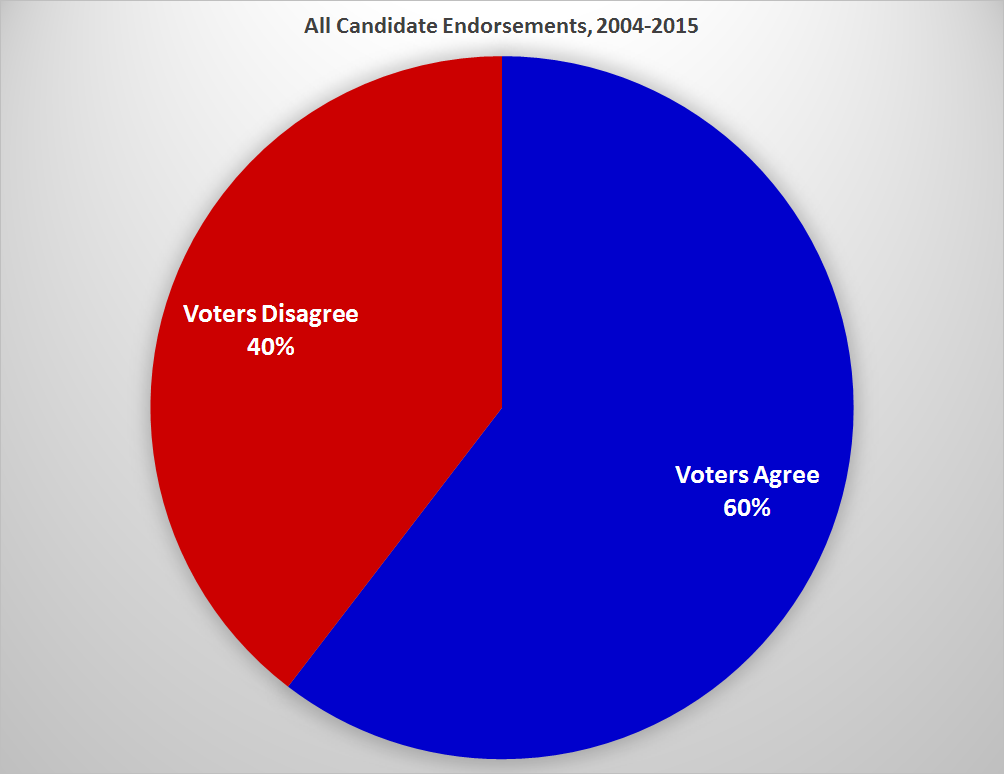
When comparing my endorsements (excluding races in which I made no endorsement) to the actual outcomes of the races, the voters agreed with my choice about 60 percent of the time, and disagreed with me about 40 percent of the time. Voters tended to be more in agreement with my endorsements at the lower levels of government. In local races, the voters agreed with my selections a whopping 68.4 percent of the time. In state level races, they only agreed with me 56.3 percent of the time. In federal races, they agreed with me 53.9 percent of the time.
Ballot Issues
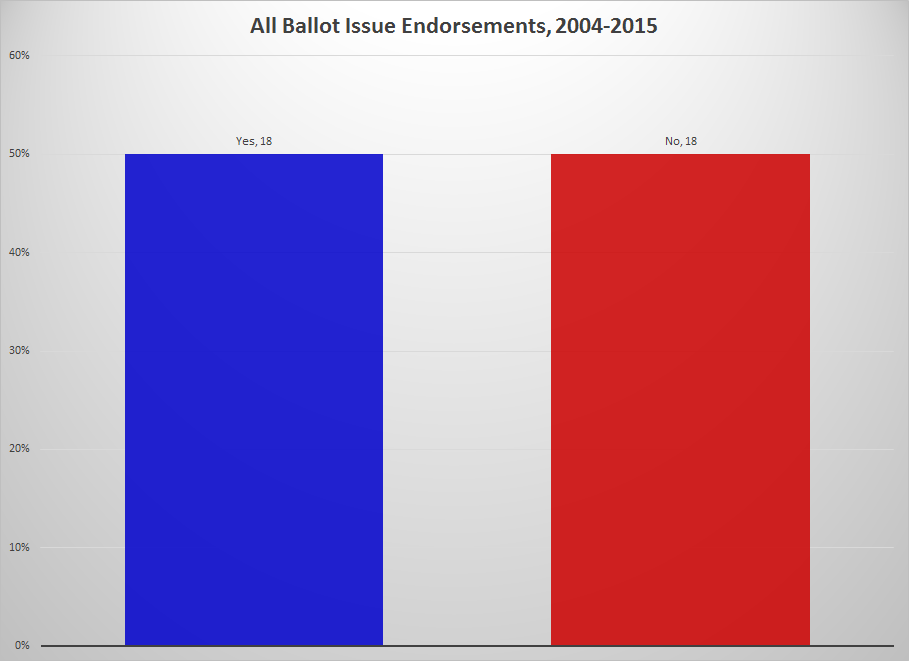
Between 2004 and 2012, I have reviewed and evaluated thirty-six ballot issues—an average of 3.27 per year. Eleven of these issues were proposed amendments to the Constitution of Virginia, and the remaining twenty-five were local bond referendums. In all, I have endorsed voting ‘yes’ and ‘no’ on eighteen issues each (an exact 50/50 split). I have made an endorsement in every ballot issue put before me since 2004.
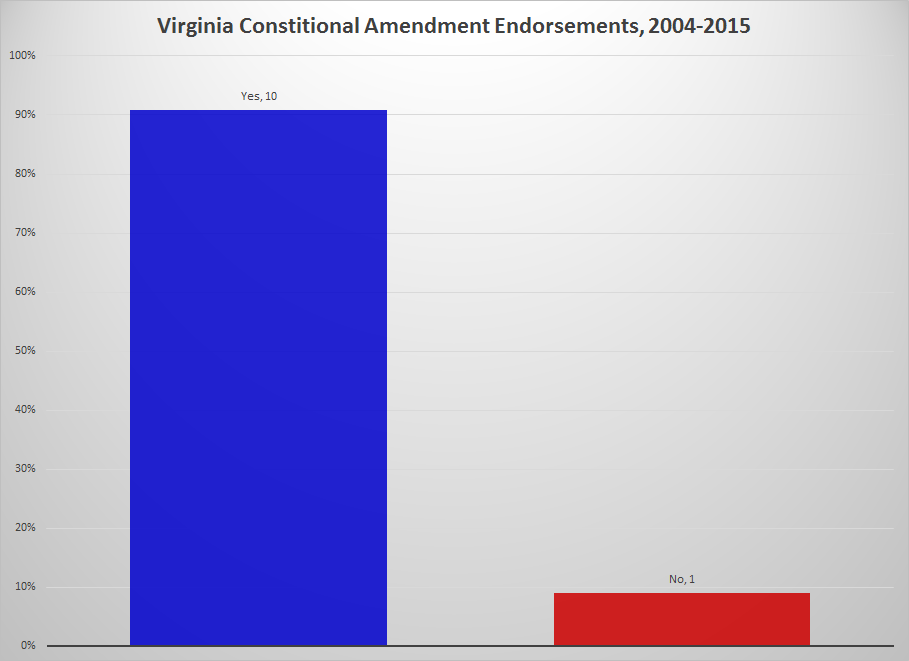
There is a very heavy skew in favor of amendments to the Constitution of Virginia. Of the eleven put before me since 2004, I endorsed voting ‘yes’ ten times (90.9 percent) and ‘no’ only one time (9.1 percent). This is mostly because the vast majority of amendments proposed in Virginia since I began making endorsements have been completely innocuous. Only two amendments were particularly controversial, and of those I endorsed one ‘yes’ (property rights in 2012) and one ‘no’ (marriage in 2006).
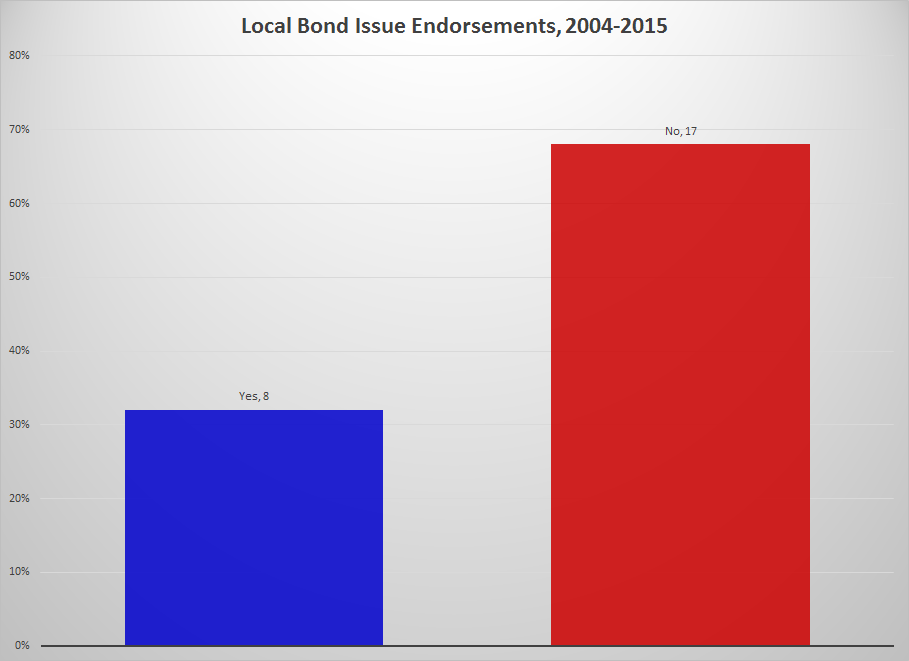
The skew goes strongly the other way when it comes to county bond referendums. In Virginia, local governments must put bond issuance to a voter referendum. Of the twenty-five such referendums put before me since 2004, I have endorsed voting ‘yes’ eight times (32.0 percent) and ‘no’ seventeen times (68.0 percent).
Government bonds are a form of public debt. They are issued in return for a short-term influx of cash, but must be repaid later plus interest. Thus, they should be used only when a project is too large to be funded directly from the general fund . . . which is rare here in the affluent counties of northern Virginia. Particularly when it comes to school bonds, I reject any major capital expenditures on U.S. schools—which are among the best-funded schools in the world—unless those expenditures are tied to significant school reform.
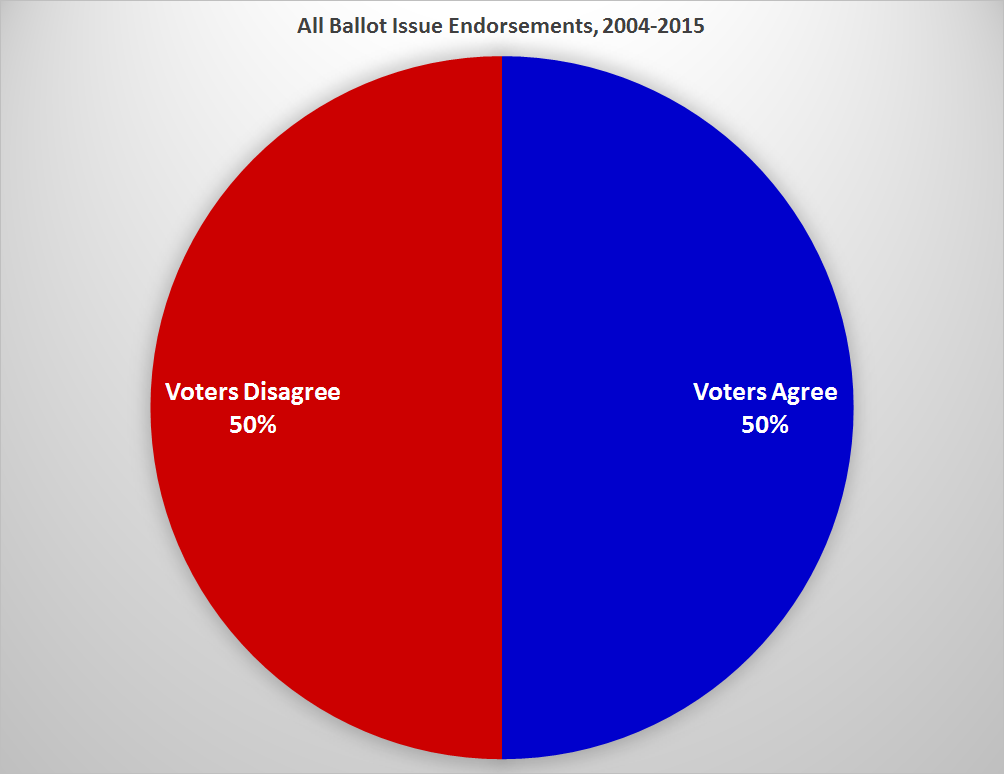
Comparing my choices with the outcomes of the votes on these ballot issues, the voters agreed with me exactly fifty percent of the time. But there is, again, a big difference here between the two types of ballot issues. On amendments to the Constitution of Virginia, the voters agreed with my endorsements 90.9 percent of the time . . . but on local bond referendums, they only agreed with me 32.0 percent of the time.
I attribute this, more than anything else, to the voters’ lack of understanding about what bonds are and when they should be used. Many simply vote ‘yes’ because they support schools, parks, roads, or whatever, and do not actually evaluate whether new public debt is necessary in each particular case.
Conclusion
Although I do continue to have a pronounced lean to the Republican side of the spectrum, I am still willing to endorse and vote for any candidate of any party (or no party) . . . if I think they deserve it. Comparing this year’s statistics to those I calculated in 2012, the general trends have remained stable.
The percentage of races in which I made no endorsement dropped slightly from 29.8 percent to 28.4 percent. The Democratic Party also lost a bit of ground, dropping from 10.6 percent to 9.0 percent. In contrast, the Republican Party’s share of my endorsements rose from 55.3 percent to 56.7 percent. Independent and third-party candidates also made gains, growing from 4.3 percent to 6.0 percent.
The continued drop in Democratic Party endorsements is largely due to the party’s hard-left shift in opposition to human rights—particularly the right to life, religious liberty, and the right to keep and bear arms. Not long ago, Virginia Democrats tended to be moderate pragmatists on these (and other) issues, but of-late they have been falling more in lock-step with a national party that has abandoned many basic American principles. This has made it much more difficult for me to support them except in some limited local races.
The Republican Party, however, has not been the sole gainer. Although the Republican Party tends to be stronger than the Democratic Party on human rights and separation of powers issues, it is not consistently putting forward candidates that are strong in these areas. Too many of the candidates put forth by the Republican Party have been old-guard members of the party machine—big-government types in the line of President George W. Bush (R), Senator John McCain (R-AZ), Governor Mitt Romney (R-MA), and Ed Gillespie (R). This is why independent and third-party candidates—mainly the Libertarian Party, but also candidates with no party affiliation—made the greatest gains in my endorsements over the last three election cycles.
As for me, I’ll keep looking at every race and making my own, independent decisions.

